Self-similarity of
Mobility
Networks

Mobility systems are inherently multi-scale, but do mobility networks exhibit self-similarity across scales? We introduce the Neighbor-Limited Box Covering method to explore self-similar structure and multi-scale spatial organization in mobility networks.

336 Chinese Cities
Human Mobility Inter-city Network
Freight Trips Inter-city Network
Map for illustration only

A so-far missing framework for mobility network renormalization

Mobility, encompassing the movement of both humans and goods, is an essential component of daily life. Mobility systems are inherently multi-scale, linking nearby places, cities, regions, and broader socio-economic systems. Yet whether mobility networks exhibit self-similarity across scales remains largely unexplored.

Although renormalization theory provides a natural framework for investigating self-similarity, existing network renormalization methods often fail to preserve the empirical structure of real-world mobility systems.

Category Handles Weighted Networks Preserves Empirical Connectivity Preserves Flow Weights
Box-covering
renormalization
× ×
Degree-thresholding
renormalization
× × ×
Geometric
renormalization
×

Core gap: A renormalization framework that preserves both the connectivity and edge-weight properties of real-world mobility networks is still lacking.

Neighbor-Limited Box Covering (NLBC) method

To address this gap, we introduce the NLBC method for renormalizing undirected, weighted networks. The method iteratively selects box centers in descending order of node strength, groups each center with a fixed number of its highest-weight neighbors into a box, and aggregates edge weights between boxes to construct the network at the next scale.

Step through the NLBC process

Here, the maximum number of nodes permitted within a box is defined as the box mass, m. Successive renormalized networks are indexed by the renormalization layer, l.
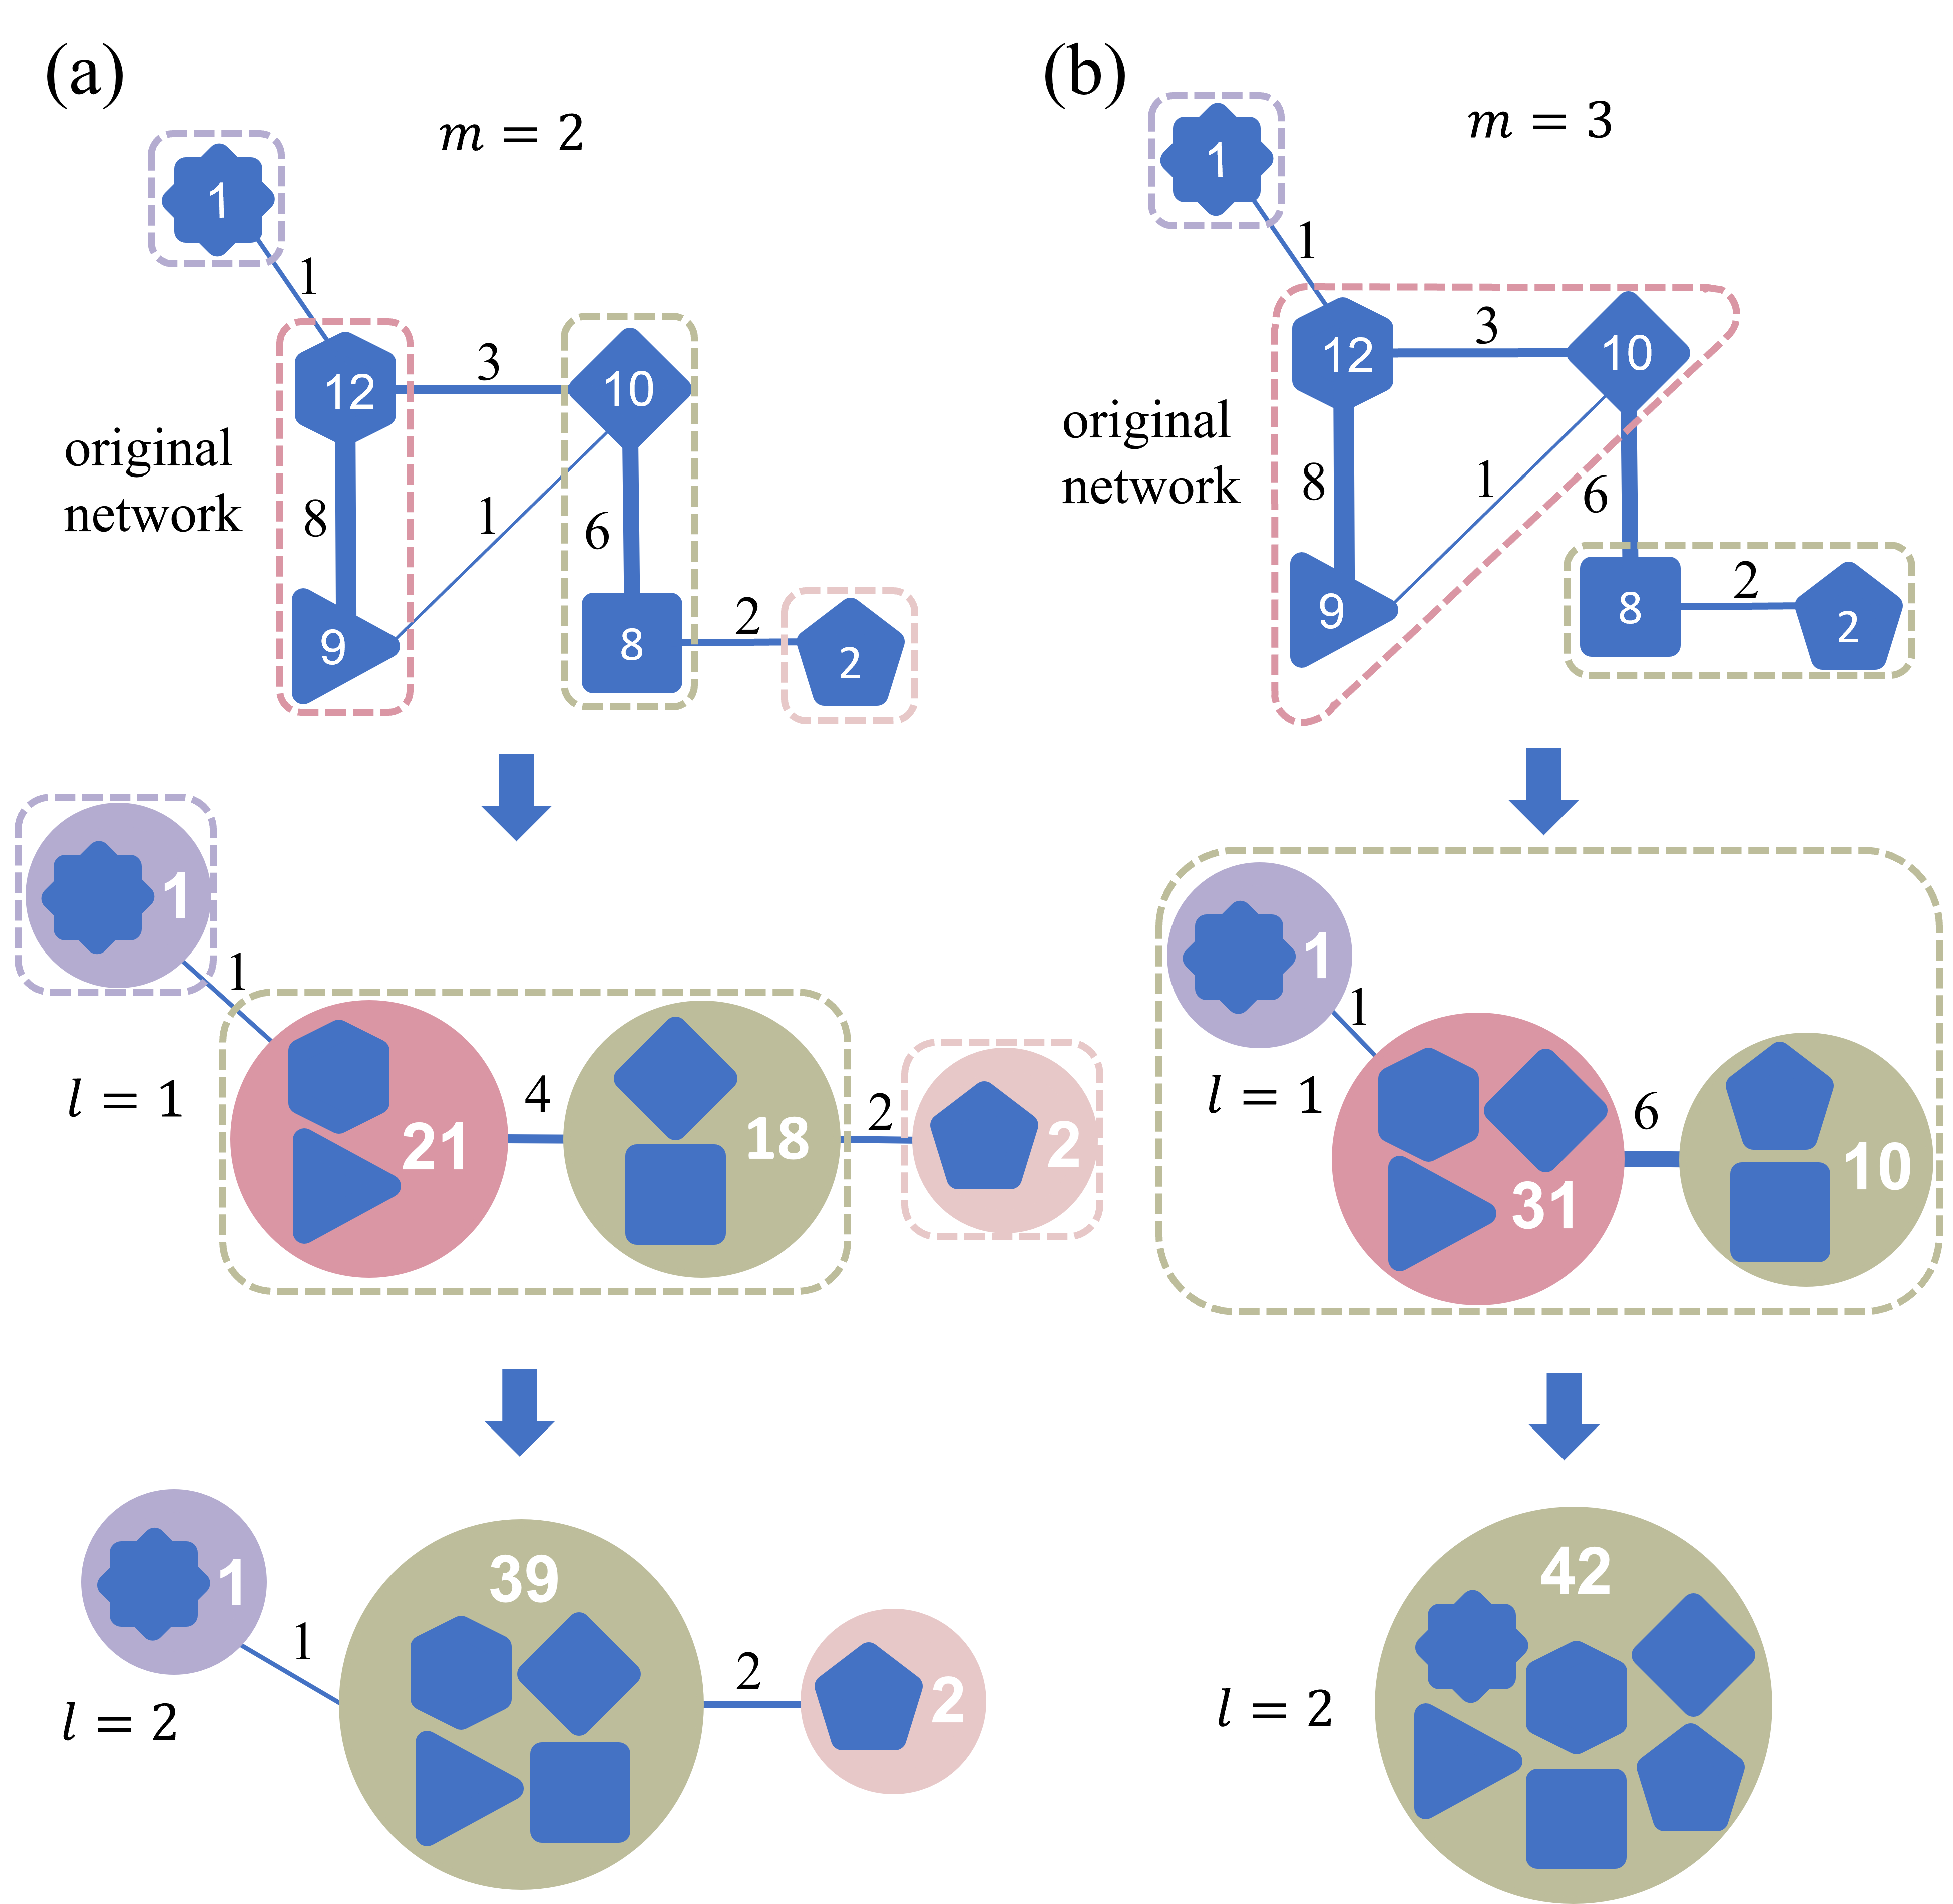
originalnetwork18316211291082
Schematic illustration of the NLBC renormalization process showing box-covering with m=2 and m=3

Fig. 1a-b. Schematic illustration of the NLBC renormalization process for (a) m=2 and (b) m=3.

Two renormalization schemes

Layer-by-layer (LL-Renorm): Repeatedly apply NLBC with a fixed box mass (e.g., m=2) to generate increasingly coarse renormalized networks.

Single-layer (SL-Renorm): Apply NLBC to the original network once for each box mass (m = 2, 3, 4, . . .) to generate increasingly coarse renormalized networks.
Two real-world mobility networks

Data sources

Human mobility: the Sina Weibo check-in records.

Freight trips: the GPS trajectory data from the China Road Freight Supervision and Service Platform.

Applying NLBC

We apply both LL-Renorm and SL-Renorm to these two mobility networks to uncover their multi-scale structures.

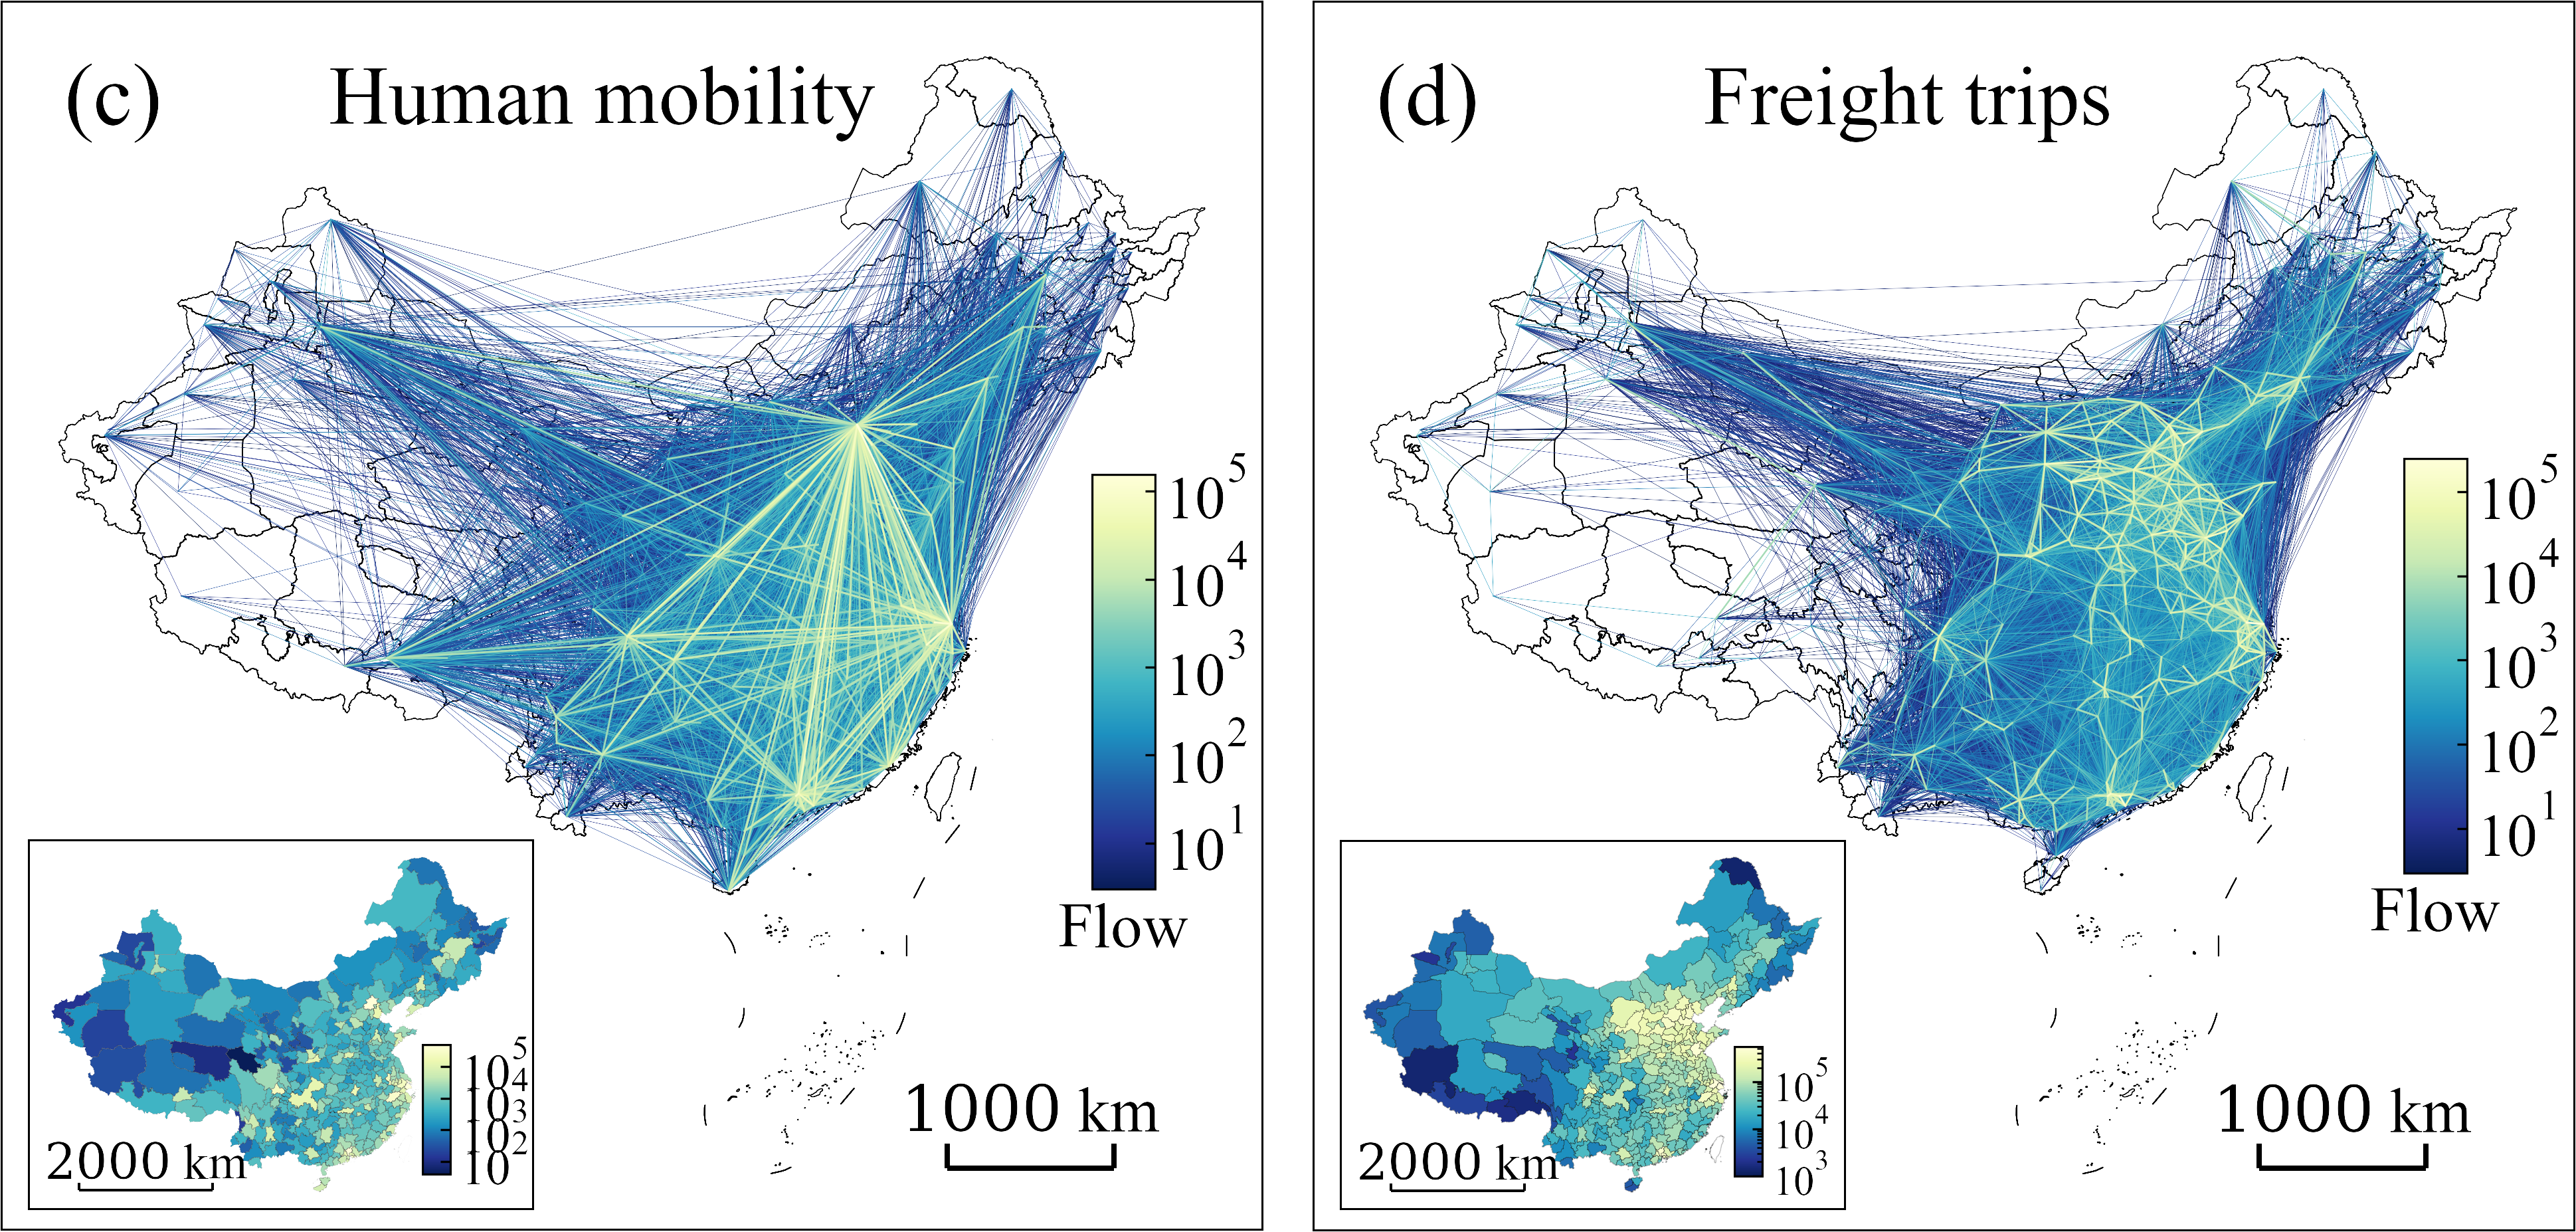
Side-by-side maps of inter-city human mobility and freight trip networks in China, showing cities as nodes and inter-city movements as weighted edges

Fig. 1c-d. (c) The inter-city human mobility network and (d) the inter-city freight trip network in China. Cities are nodes, and inter-city movements are undirected, weighted edges.

A. Self-similarity of multi-scale mobility networks

We evaluate the self-similarity of multi-scale mobility networks in terms of topological structure, weighted structure, and dynamical processes.

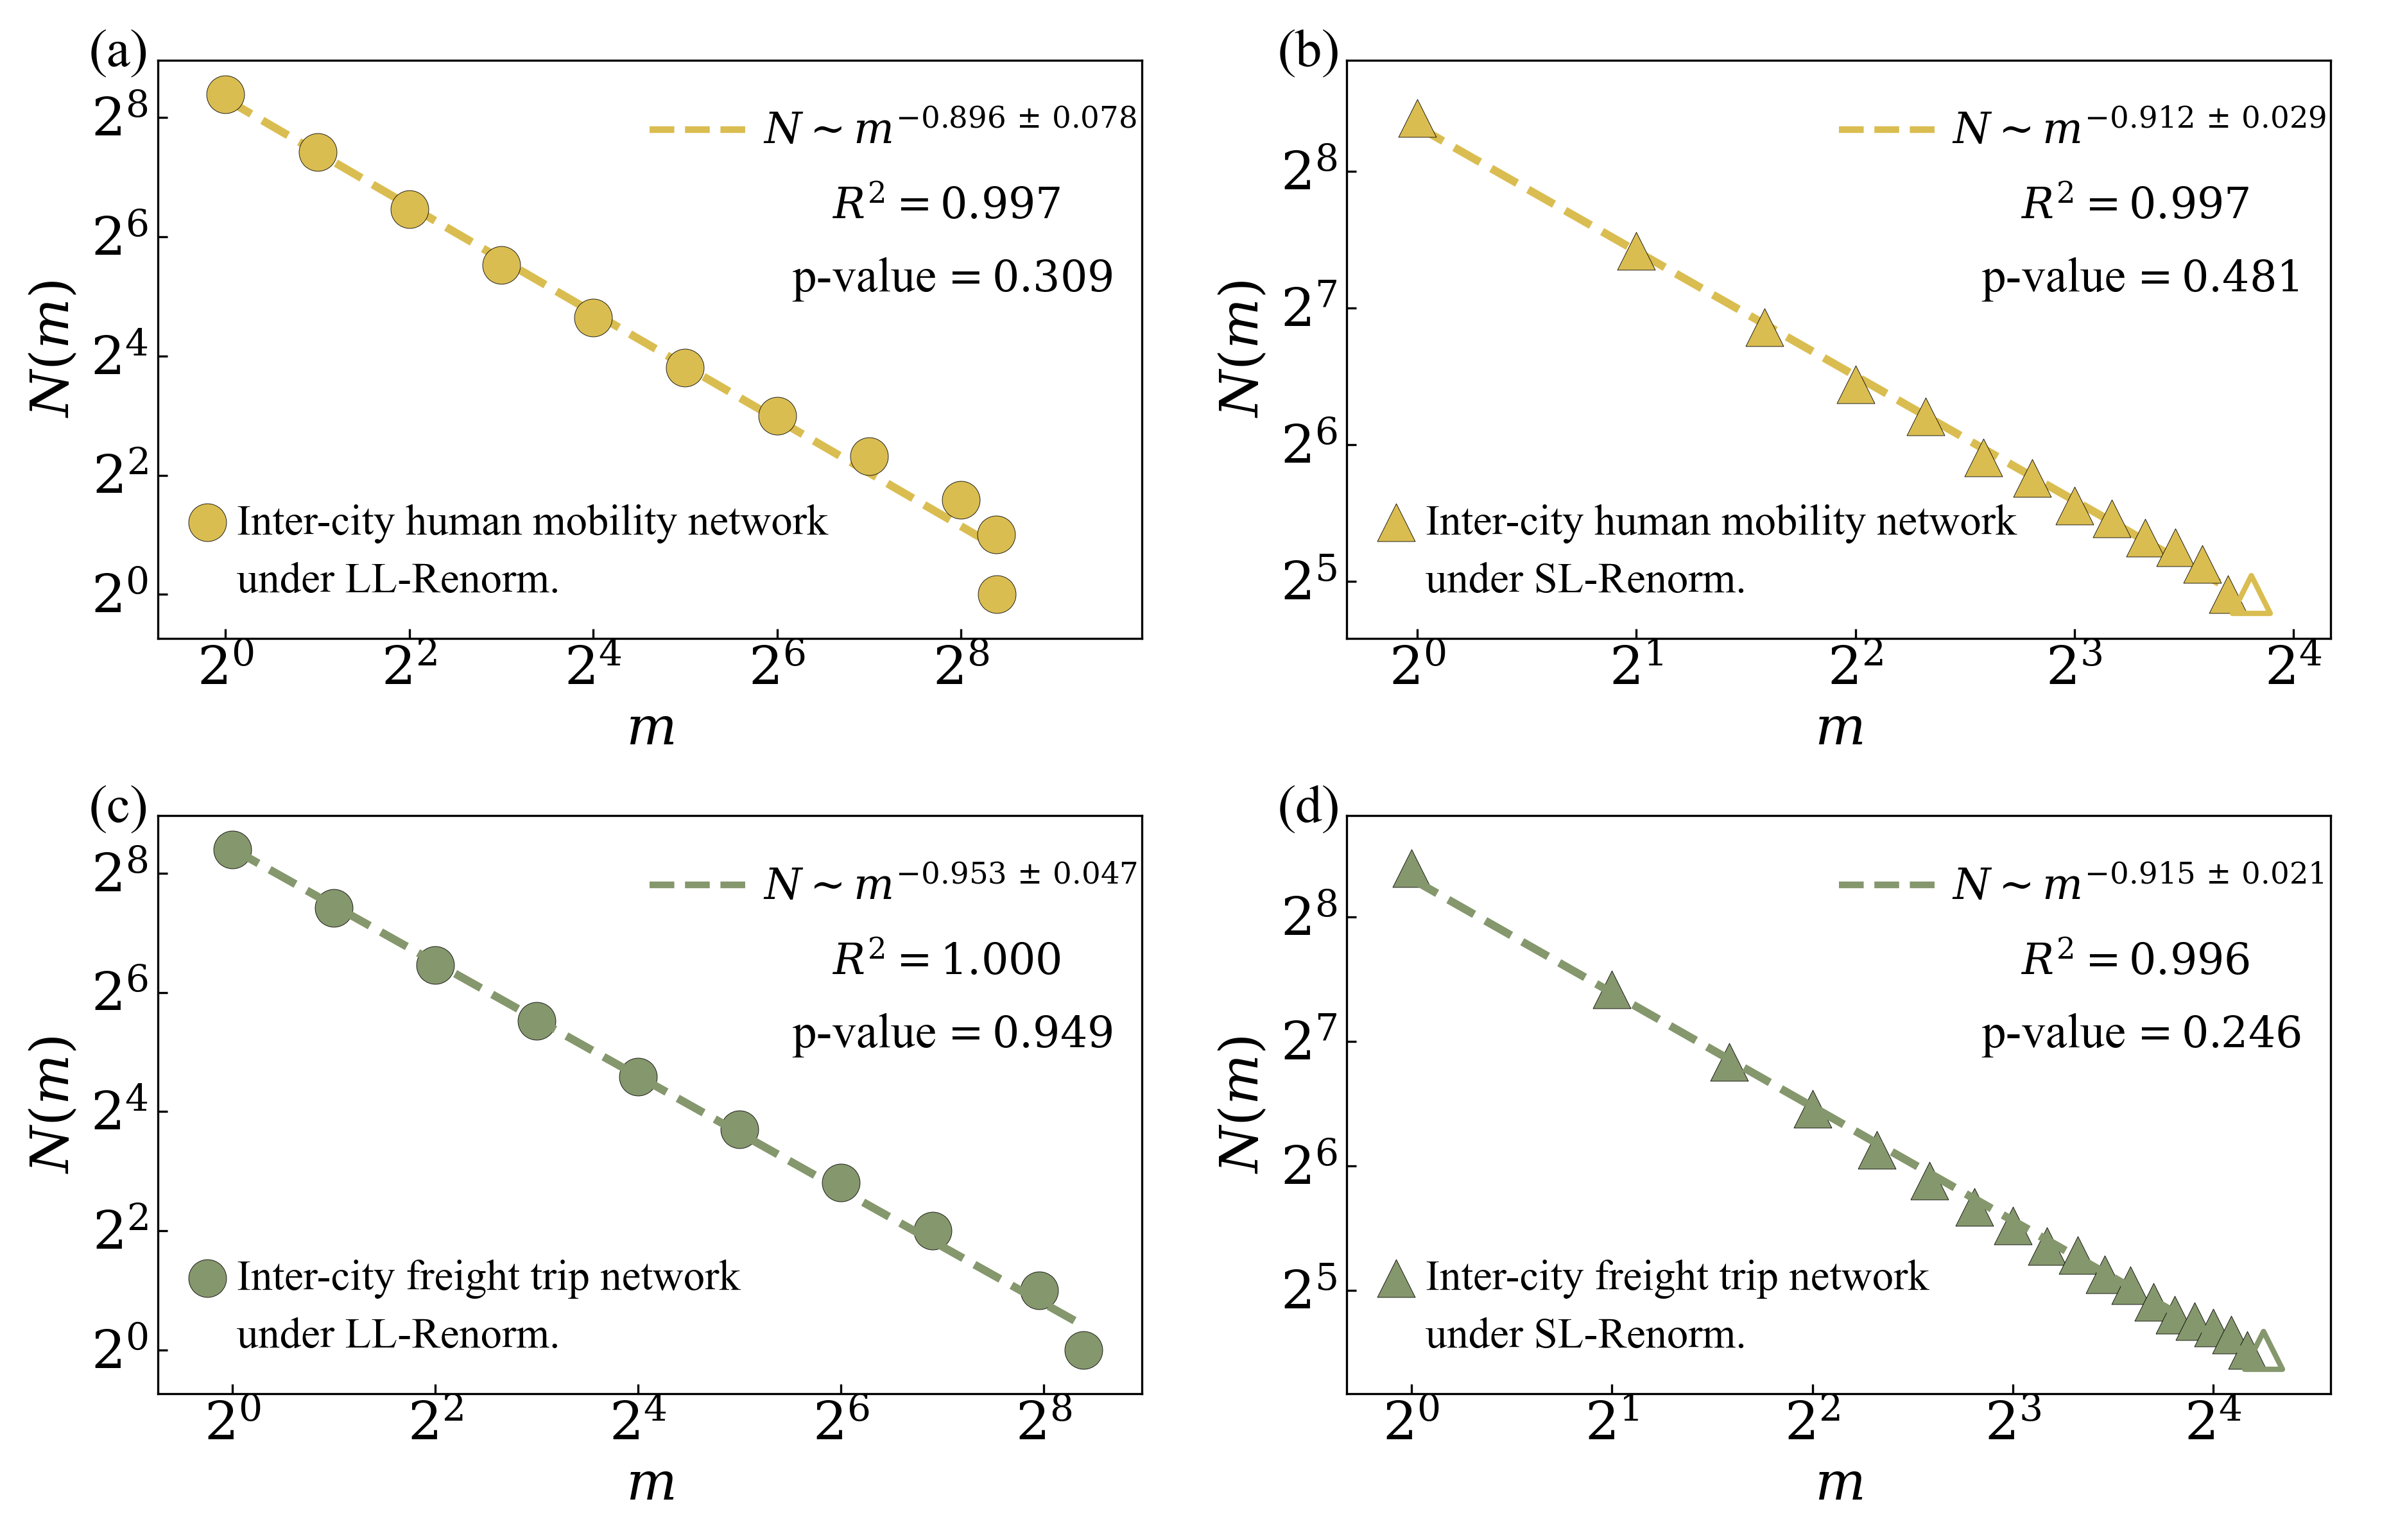
Topological structure similarities We calculate the fractal dimension df to quantify topological similarity in multi-scale mobility networks. The log-log plots of box number N(m) versus box mass m show clear power-law scaling, indicating self-similar topological structure across scales.

Log-log plots showing power-law scaling of box number versus box mass for human mobility and freight networks under LL-Renorm and SL-Renorm

Fig. 2. Self-similar scaling of human mobility and freight trip networks under LL-Renorm and SL-Renorm.

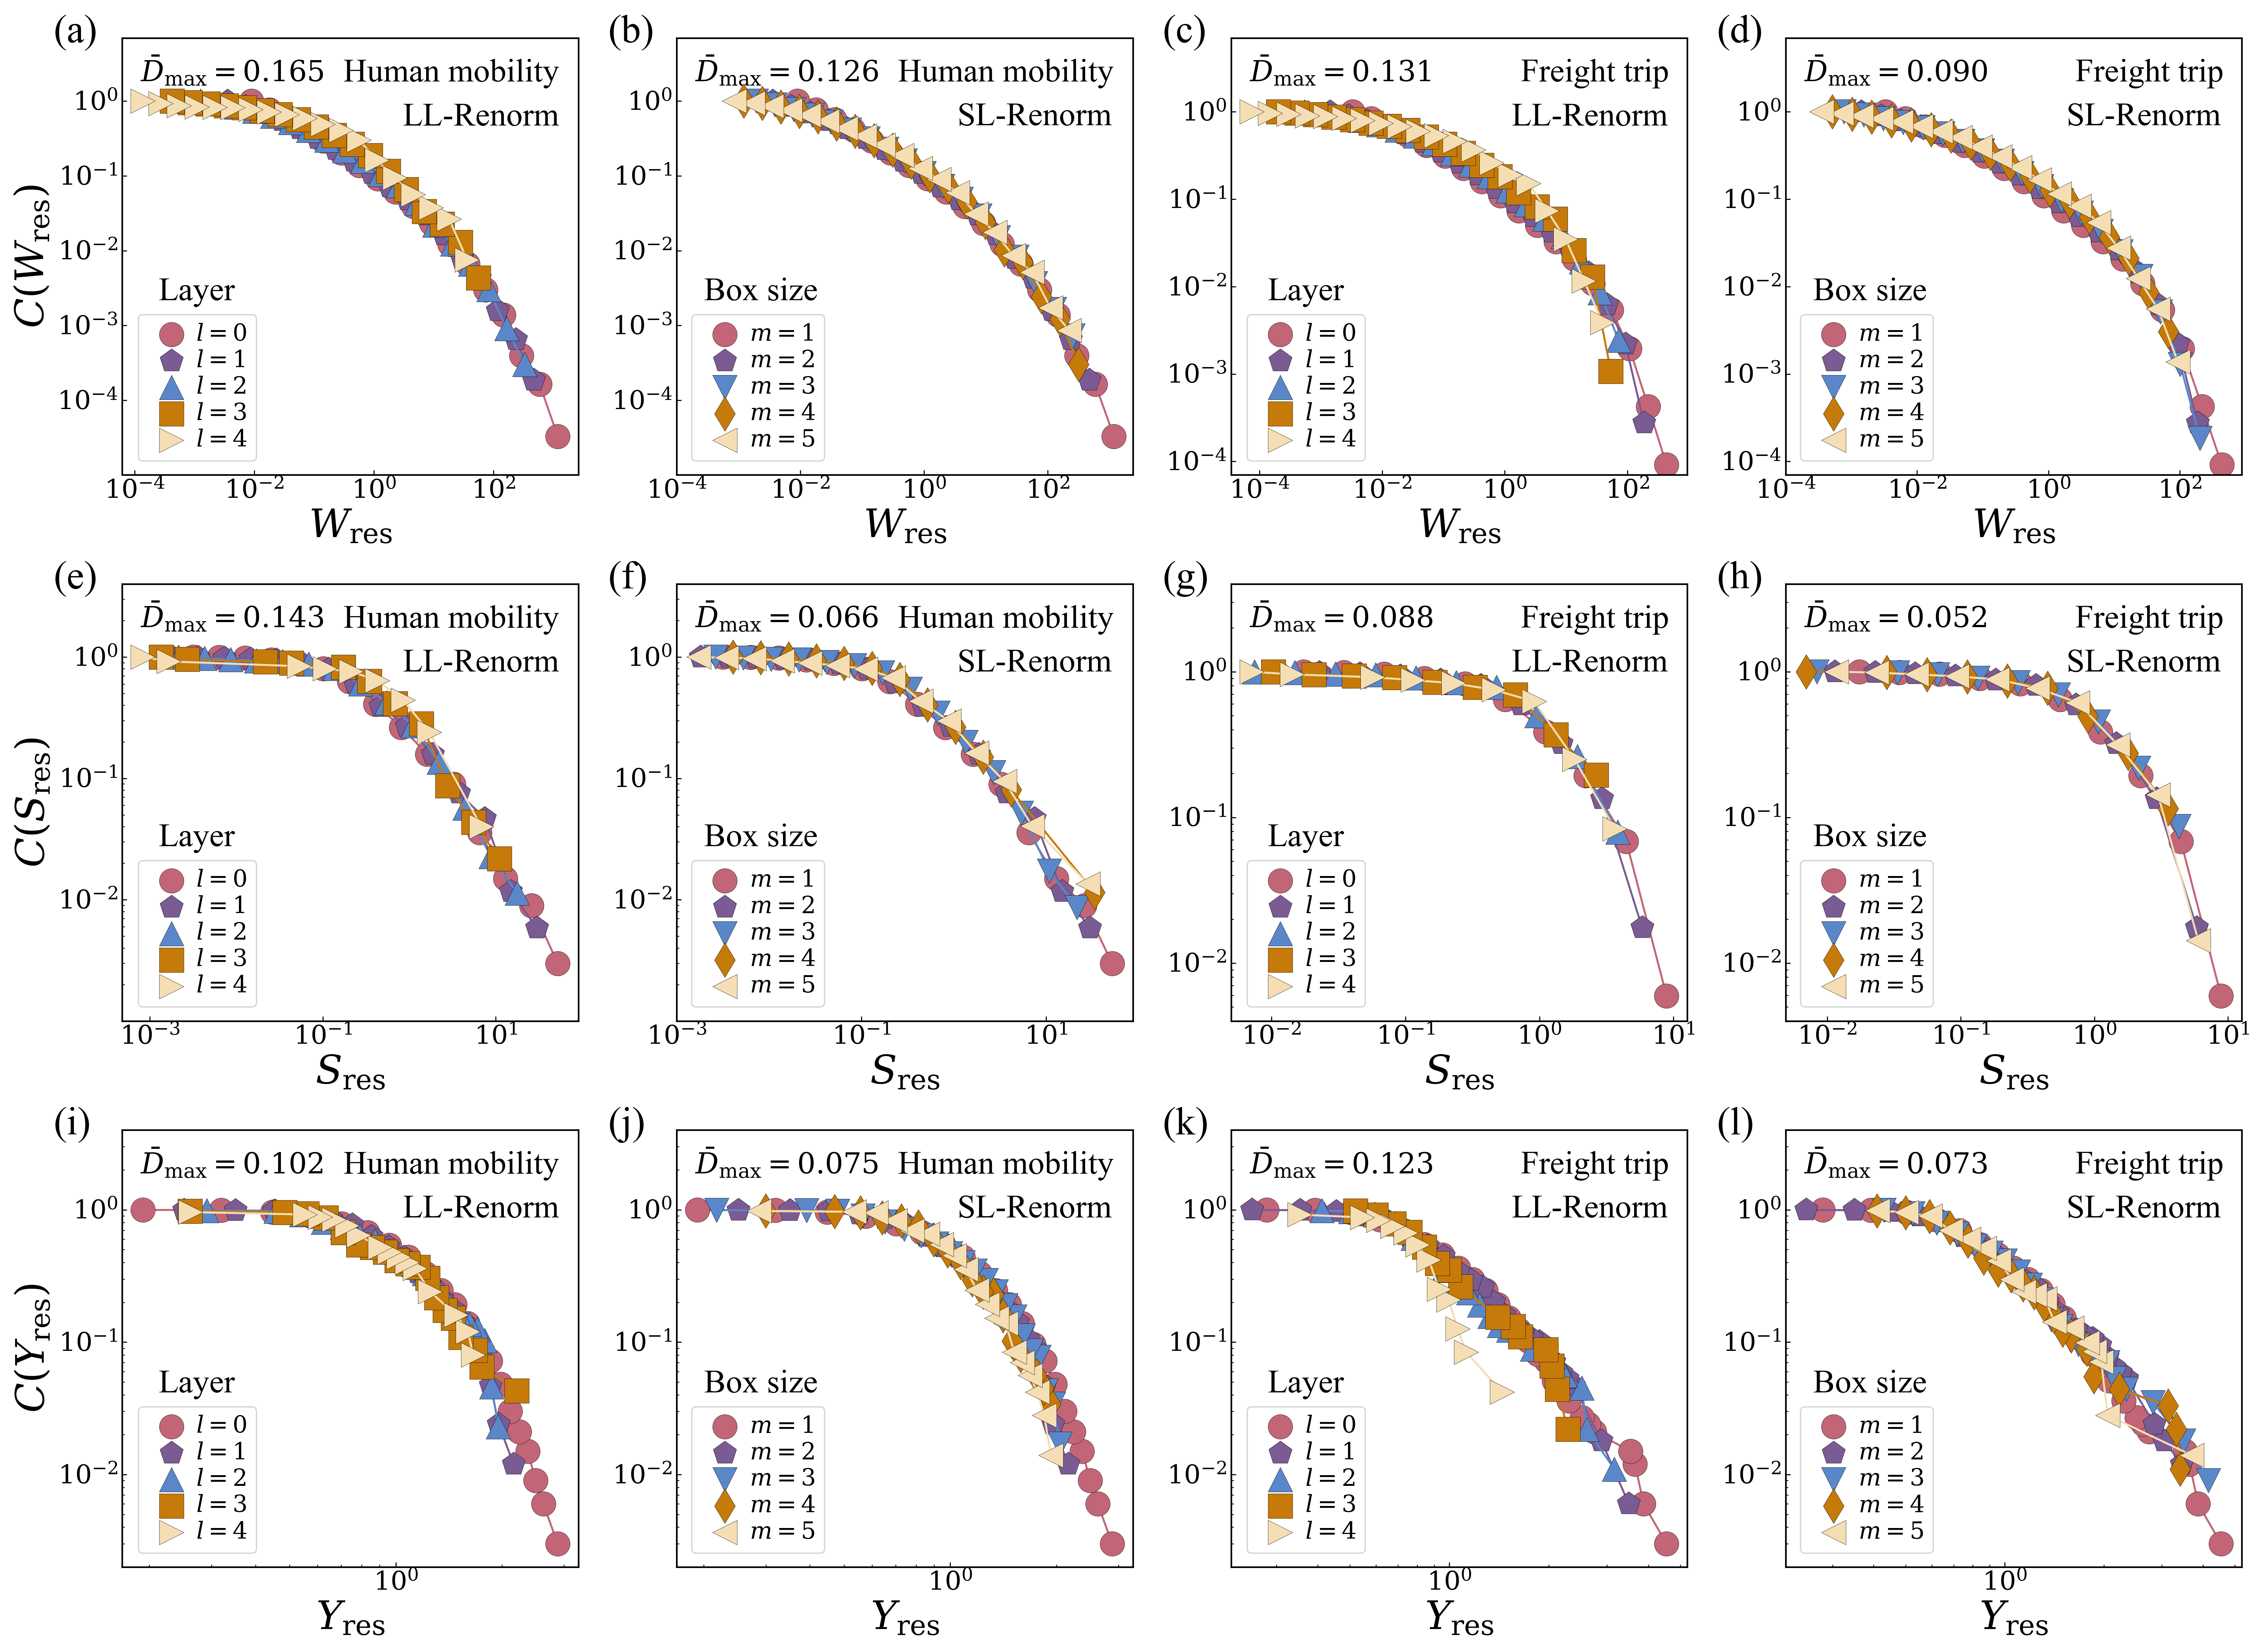
Weighted structure similarities We calculate edge weight wij, node strength Si, and node disparity Yi for multi-scale mobility networks. Their rescaled complementary cumulative distribution functions merge onto nearly identical curves, indicating self-similar weighted structure across scales.

Complementary cumulative distribution functions of edge weights, node strengths, and node disparities across renormalization layers, showing data collapse

Fig. 3. The weighted structural features for the multi-scale mobility networks.

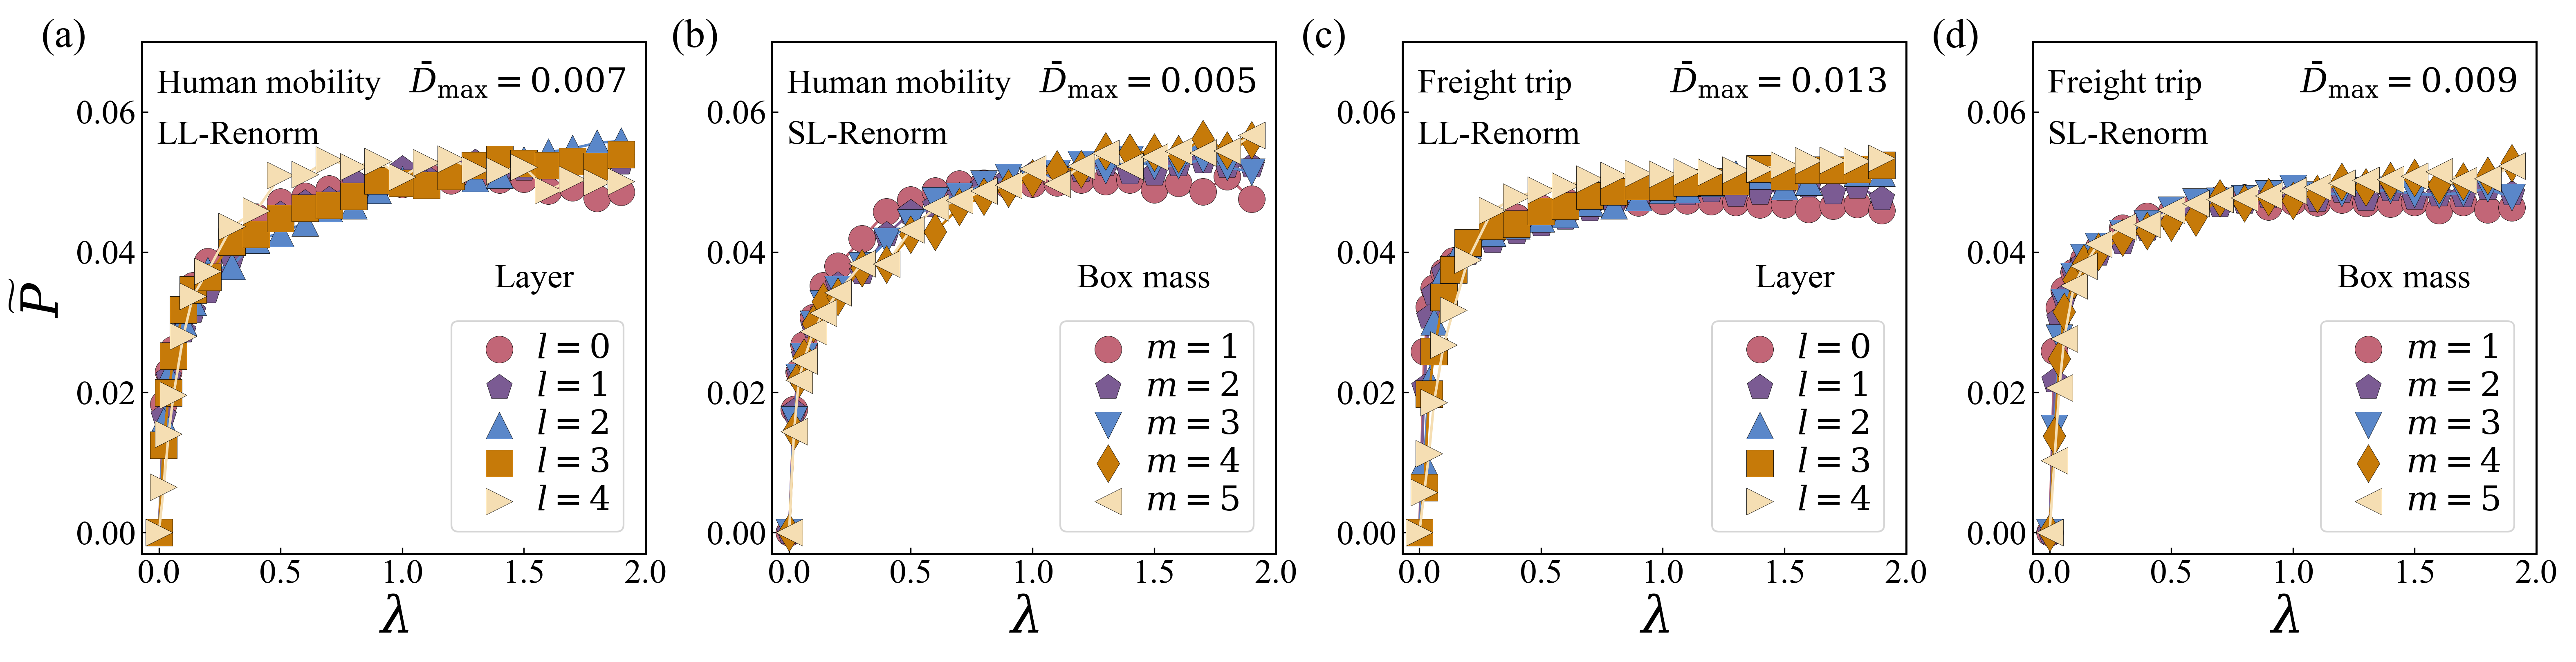
Dynamical process similarities We simulate a weighted susceptible-infected-susceptible (SIS) epidemic spreading model on multi-scale mobility networks. The relationship between infectivity λ and relative infection proportion remains similar across scales, indicating self-similar epidemic dynamics.

Relative infection proportion versus infectivity curves showing overlap across renormalization scales for both network types

Fig. 4. Epidemic spreading dynamics on multi-scale mobility networks.

B. Spatial organization of multi-scale mobility networks

Although NLBC uses only mobility interactions, the resulting renormalized networks exhibit clear spatial cohesion when projected onto geographic maps. At coarser scales, the renormalized groups further align with established political and socio-economic boundaries, with fourth-layer human mobility groups corresponding to some provincial boundaries and second-layer freight trip groups corresponding to the core regions of several urban agglomerations.

Selected geographic maps showing human mobility at layer 4 and freight trip at layer 2

Fig. 5. Geographic maps of selected LL-Renorm layers for the inter-city human mobility (l=4) and freight trip (l=2) networks. Nodes within the same renormalized node are represented by the same color.